A First Glance at Election Results and Trends: State Races and Ballot Measure Results

Please note that this article is based on projected results and may change with certified election results.

Polls are closed on the 2022 general election where voters in 46 states decided on 6,278 state legislative races, 36 governors and 133 statewide ballot measures. The Council of State Governments, the nation’s only nonpartisan organization serving all three branches of state government, will provide coverage and analysis of state elections with attention to state races and the impact of ballot measures. This article provides an overview of the results and trends in state races and ballot measure results based on projections made through midday Nov. 9.

States are seeing increased diversity in elected candidates.

Several races, projected by Ballotpedia, are historical firsts, expanding gender, race and age representation amongst elected officials. Governor Sarah Huckabee Sanders (R), former press secretary for President Donald Trump, made history in Arkansas as the first female governor in Arkansas. Governor Maura Healy (D) of Massachusetts and Governor Kathy Hochul (D) of New York also made history as the first female elected governor in their respective states. Governor Healy is also the first openly lesbian governor in the US and the first openly gay governor in Massachusetts. U.S. Representative Marcy Kaptur (D) became the longest-serving female member of Congress with reelection to Ohio’s 9th District. Governor Wes Moore became the first Black governor of Maryland and his lieutenant governor, Aruna Miller (D), is the first immigrant and first Asian American to be elected to statewide office in Maryland. In Rhode Island, Chinese American Victoria Gu (D) and Japanese American Linda Ujifusa (D) became the first Asian candidates elected to the state legislature, and Shri Thanedar (D) became the first Indian American U.S. Representative for Michigan. Maxwell Frost (D) won Florida’s 10th Congressional District race, making him the first Democratic member of Congress from Gen Z and the first Afro-Cubano to head to Congress.

Partisan legislative and state control remains steady with Democrats consolidating power in some states.

So far, Democrats have consolidated power in several states – Maryland, Massachusetts, Michigan and Minnesota. Previously, these states were under a divided government. No new state government trifectas have been called for Republicans yet, and no state governments that were trifectas controlled by one party have moved to divided government yet. However, these results may change as more state elections are called. Partisan legislative control remains relatively steady as election results are projected. The Democratic Party in Minnesota has consolidated legislative power from previously split control, and Michigan has flipped from Republican legislative control to Democratic control. Results have not yet been projected for six states which may change these results.

Incumbent Governors are being re-elected and the Democratic party has gained some control.

This year there are 36 governor seats up for reelection, currently, 32 of the races have been called. Seven governors did not seek reelection. Democrats have picked up two governor seats in Maryland and Massachusetts. Currently, every incumbent governor that was up for reelection has won. There are currently six newly elected governors; Maura Healy (D) Massachusetts, Sarah Huckabee Sanders (R) Arkansas, Jim Pillen (R) Nebraska, Josh Green (D) Hawaii, Josh Shapiro (D) Pennsylvania and Wes Moore (D) Maryland. Governor races that have not been confirmed yet are Alaska, Arizona, Nevada and Oregon. In the US Territories incumbent Lou Leon Guerrero (D) won reelection in Guam. Incumbent Albert Bryan (D) won reelection as governor of the US Virgin Islands while incumbent Ralph Torres (R) is facing a runoff versus Arnold I. Palacios (I).

With his win in Maryland, Wes Moore is a growing figure nationally among Democrats. Governor Ron DeSantis handedly won reelection in Florida by wide margins and continues his growth as a leader in the GOP and potential presidential candidate in 2024.  

States have passed ballot measures addressing state legislative authority, election administration and voting-related policies and state tax changes.

On the ballot this year were several possible changes to some states’ constitutional amendment processes. So far, Arizona’s Proposition 132 is too close to call. If enacted, this measure will require a 60% majority for future constitutional amendments that approve new taxes. In Arkansas, Issue 2 was defeated. This measure would have required a 60% majority for future constitutional amendments.

Some states considered changes to voting policy and election administration. Nebraska voters approved Initiative 434, requiring a photo ID for voting. Ohio passed Issue 2, prohibiting local governments from allowing anyone who does not meet the qualifications for an elector (e.g. a non-citizen) to vote in local elections. Connecticut voters approved Question 1, allowing the legislature to establish early voting. Michigan approved Proposal 2, which made several changes to voting procedures including creating a 9 day early voting period, requiring photo ID, requiring military and overseas ballots postmarked by election day to be counted, prohibiting voter intimidation and several other changes. A proposed photo ID requirement in Arizona and Nevada’s possible adoption of ranked choice voting are still too close to call.

At least six states proposed ballot measures changing state tax laws. In California, voters rejected Proposition 30, which would have raised taxes on those making more than $2 million to subsidize electric vehicle infrastructure and wildfire prevention. Colorado voters passed Proposition 121, lowering the income tax from 4.55% to 4.40%. West Virginia failed to pass Amendment 2, which would have allowed lawmakers to exempt property taxes on motor vehicles and personal property used by businesses. The results of Arizona’s Propositions 130 and 310, allowing lawmakers to pass a personal tax exemption and increasing sales taxes to fund fire districts, are too early to call. Massachusetts voters passed Question 1, imposing an additional 4% tax on those making over $1 million to fund education and transportation. Idaho approved the Advisory Question, which asked voters for their opinion on tax changes including additional rebates to taxpayers, reduction of the corporate tax rate and allocation of tax revenue to education.

States have passed ballot measures addressing the regulation of marijuana, abortion and enslavement.

Several state elections included ballot measures addressing marijuana, abortion and enslavement. According to the Pew Research Center, Millennials are at the forefront of the recent rise in public support for the legalization of marijuana and abortions. It is likely that these ballot measures motivated Millennials and younger generations to vote in the 2022 elections.

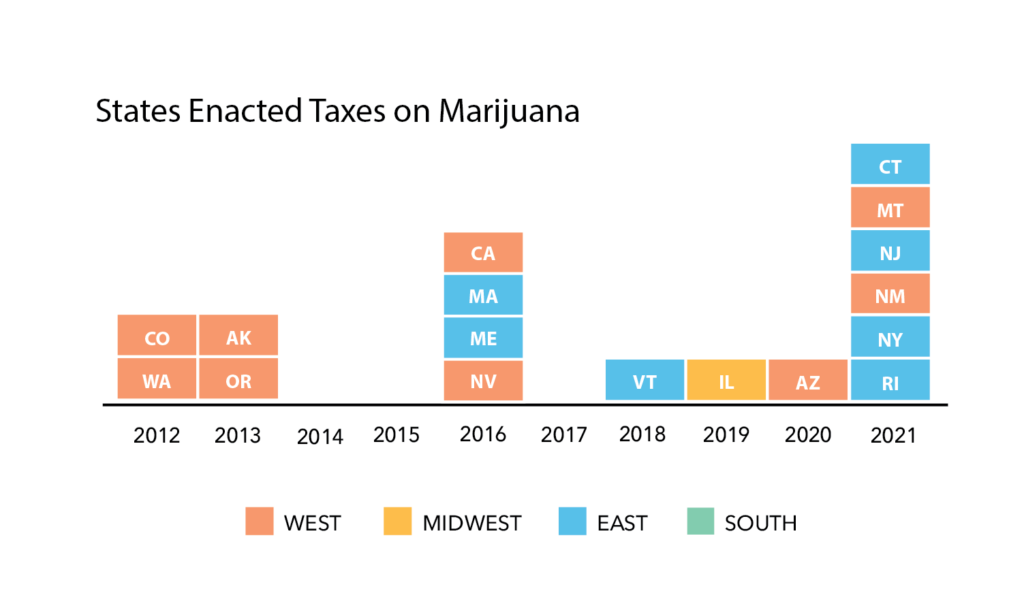
Before the elections, marijuana was legal in 19 states and D.C. Of those 19 states, 13 and D.C. had legalized marijuana through the ballot measure process. During the 2022 midterm elections, Maryland and Missouri passed ballot measures legalizing marijuana. Arkansas, North Dakota and South Dakota rejected ballot measures legalizing marijuana.

There were five ballot measures addressing abortion in the midterm elections. California, Michigan and Vermont voted to add “reproductive freedom” to their state constitutions, and Kentucky voted no to a constitutional amendment stating nothing in the state constitution creates a right to abortion or requires government funding for abortion. Montana results are not confirmed, but current results look like abortion rights will remain.

As of October 2022, 20 state constitutions included language permitting enslavement or servitude as criminal punishment or debt payments. During the 2-22 midterm elections, five states had ballot measures repealing such language. Alabama, Oregon, Tennessee and Vermont have voted to repeal language allowing slavery or involuntary servitude as criminal punishments. Louisiana voted not to repeal language allowing involuntary servitude as criminal punishments which may be due to confusion with the wording of the ballot measure.

CSG will continue to provide initial results on key topics as well as more in-depth analysis in the days following the election. Find those articles on Twitter (@CSGovts) and at csg.org/state-talk.

Pre-Apprenticeships: A Pathway for Career Success in North Carolina

By Enmanuel Gomez Antolinez

Learning and upskilling can be a life-long pursuit in the dynamic, constantly changing U.S. economy. Educational opportunities for youth and young adults with disabilities (Y&YAD) should reflect this reality. But all too often, they encounter barriers to acquiring knowledge, learning new skills and accessing general workplace experience.

Apprenticeships are an important and rapidly expanding pathway for all individuals, including Y&YAD. In the 2021 fiscal year, more than 241,000 new apprentices entered the national apprenticeship system. However, research demonstrates apprenticeships are not always accessible to everyone since they may require certain skills or experiences to enter. Pre-apprenticeships are one pathway that prepares Y&YAD for apprenticeships and makes apprenticeships more accessible by providing work-based learning, academic knowledge and professional skills. Several states, including North Carolina, are developing pre-apprenticeships specifically for Y&YAD to support them in their path to apprenticeship and full-time employment.

According to the U.S Department of Labor “pre-apprenticeships are designed to prepare individuals for entry into Registered Apprenticeship Programs (RAP) or other job opportunities.” These programs can play a valuable role in initiating career pathways for anyone, including Y&YAD. Pre-apprenticeships are available in a range of industries including health care, information technology, manufacturing, hospitality and retail.

A notable resource for policymakers is Getting Started with Pre-Apprenticeship: Partnership’s Primer, which provides detailed information on pre-apprenticeships, partnerships, program development and funding.

As outlined in the primer, pre-apprenticeships benefit both states and Y&YAD because they:

  • Have the potential to increase annual earnings and employment of workers with disabilities.
  • Are designed to give people of color, women, Y&YAD and other underrepresented populations the skills, confidence and connections they need to be successful.
  • Provide an effective workforce development strategy that results in a net benefit to society and diversifies the talent pipeline of skilled workers.
  • Provide academic knowledge and skills training tailored to specific jobs and industries for participants who face barriers to employment.

The North Carolina Career Launch is an example of a state-supported pre-apprenticeship for Y&YAD. This program provides a series of curricula that give students opportunities to gain knowledge, experience and credentials that lead to jobs in high-demand fields and a living wage. One of the North Carolina Career Launch programs within the health care industry is the Pre-Nursing Careers Vocational Rehabilitation Youth Apprenticeship. This pre-apprenticeship program provides paid on-the-job learning to high school students with disabilities as well as employment and professional development skills and work and training preparation.

In order to successfully implement these programs and provide the right support and practical skills to students with disabilities, there must be a clear relationship with vocational rehabilitation offices to pilot the program, as well as register the program statewide so it does not have to be replicated again. State agencies can collaborate to provide Y&YAD with pre-apprenticeship opportunities like the one in North Carolina.

Diverse pre-apprenticeships have the potential to support Y&YAD to access a career path that offers living wages and benefits. These jobs are an opportunity to prepare and support students for success and ensure they are prepared to be successful in their apprenticeship.

For more information about pre-apprenticeships, please visit: https://www.apprenticeship.gov/help/what-pre-apprenticeship

How States Can Use American Rescue Plan Act Funding for Affordable Housing

By Blair Lozier

The U.S. Department of the Treasury has updated guidance that expands the use of the American Rescue Plan Act State and Local Fiscal Recovery Funds for affordable housing.

The Treasury released a How-to Guide that demonstrates how recipients can leverage the fiscal recovery funding with other sources to maximize resources to meet housing needs. This article summarizes the expanded options that states may pursue to invest State and Local Fiscal Recovery funding in affordable housing.

The guide discusses two options available to states.

Option 1: State and local governments can use recovery funds for affordable housing projects that are categorized in the American Rescue Plan Act under Public Health and Negative Economic Impact. Recipients are presumptively eligible for additional funding if they already qualify for related pre-existing federal programs.

Expanded Presumptive Eligibility

A project is deemed to be presumptively eligible if it meets standards for pre-existing federal programs set by the Treasury. If the housing units or development in question meet the presumptive eligibility requirements, no further approval process will be required.

The Treasury presumes that the following affordable housing investments are eligible uses of fiscal recovery funds in response to the negative economic impacts of COVID-19: 

Projects already in process under authorization by another federal housing programProjects for developing, repairing or operating affordable rental housing with certain requirements for tenant income and affordability.

Expanded Presumptive Eligibility Programs

Previous ProgramsExpanded ProgramsIn January 2022, Treasury designated two U.S.
Department of Housing and Urban Development programs that would allow recipients to be
presumptive eligible.
Housing Trust Fund
HOME Investment Partnerships Program        Treasury allows housing projects to be presumptively eligible if they meet existing requirements for the following federal programs.  
Individuals
Project-Based Rental Assistance 
Section 811 – Supportive Housing for Persons with Disabilities Program 

Developers
Low-Income Housing Tax Credit
National Housing Trust Fund
Public Housing Capital Fund
Section 202 – Supportive Housing for the Elderly Program 

State and Local Governments
HOME Investment Partnerships Program
Multifamily Preservation and Revitalization Program 

Tribal Governments
Indian Housing Block Grant Program 
Indian Community Development Block Grant Program 
Bureau of Indian Affairs Housing Improvement Program

Option 2: Allow State and Local Fiscal Recovery Funds to be used if the housing units funded serve households at or below 65% of the average median income for at least 20 years.

Blended Funding

Blended funding is the merging of funds from different sources for the delivery and increased impact of services. States can blend fiscal recovery funds with other resources as long as projects are eligible under all programs from which funds are drawn. Blending State and Local Fiscal Recovery Funds with other government funding must adhere to all federal requirements for cost-sharing/matching.

Funding new and substantial affordable housing. Funds can be used to finish construction projects by bridging gaps in financing. It can also be used to expedite the construction or transformation of affordable housing projects.

Pre-Existing Federal ProgramsState and Local Fiscal Recovery Funding OpportunitiesLow Income Housing Tax CreditFour to nine percent can be allocated for new construction or preservation of affordable housing.Federal Housing Administration Multifamily Mortgage InsuranceFunding can be provided to cover the cost of the project.HOME Investment and Housing Trust FundParticipating jurisdictions may use recovery funds to meet affordable housing production and repair goals.HOME Investment Partnerships American Rescue Plan ProgramFunding can be blended with other American Rescue Plan Act resources to support the acquisition or construction of rental houses for eligible populations.Project-Based VouchersFunding can be blended with local public housing authorities to be used to build or rehabilitate affordable housing units.Recapitalization of Public Housing through a Rental Assistance DemonstrationFunding can support transactions to add new affordable housing.Community Development Block Grants and Section 108 Loan Guarantee ProgramFunding can be blended to invest an annual installment to support conversion or reconstruction projects; also, can be used to make eligible affordable housing investments.

Existing properties that will be transformed into affordable housing

Recipients can acquire market-rate rental properties, hotels, motels or properties that will be converted to affordable housing. Other allowable uses include acquiring or preserving existing publicly-supported affordable housing or financing retrofits to and weatherizing of existing properties to improve energy efficiency.

Opportunities for Blended Funding with Federal Housing Administration Multifamily Mortgage InsuranceMortgage insurance for purchase or refinancing of existing multifamily rental housing under
Section 223(f) of the National Housing ActThe fiscal recovery fund provides support to finance or refinance a property acquisition.Risk Share Section 542 (c )The fiscal recovery fund allows a risk share loan for the acquisition or refinance of affordable properties.

Opportunities for Blended Funding for Vacant or Abandoned Properties in Disproportionately Impacted CommunitiesSection 108 of the Loan Guarantee Program and
HOME Investment or Housing Trust FundFunding can be used for the eligible housing portion for mixed-use development.

Whether the project is entirely or partially funded through the State and Local Fiscal Recovery Fund, the government must report the obligating of funds to the Treasury by Dec. 31, 2024, and must expend funds by Dec. 31, 2026.

State Examples Presumptive eligibility was expanded to respond to questions and concerns about allocation of fiscal recovery funds. The Treasury established four core requirements for presumptive eligibility:

Resident income restrictions.Tenant protections.Housing quality standards.Affordability period for assisted units.

The Illinois The Housing Development Authority allocated $75 million in recovery funds to provide gap financing and underwriting for affordable housing developments. Grant funding will support 1,023 units in 19 affordable developments.

The Rhode Island Rebounds Production Fund Program is using $15 million for the production of new affordable housing and provides grants for households with incomes at or below 80% of average median income in the state.

Additional examples of states using the State and Local Fiscal Recovery Funds for affordable housing as reported from the Treasury can be found here.

Additional Clarification

About $350 billion was dedicated to developing, repairing and operating affordable housing units under the State and Local Fiscal Recovery Fund. As of March 31, 2022 Treasury data showed that over 600 state and local governments budgeted about $12.9 billion in funds toward affordable housing. The initiatives focused on lower housing-related costs and creating and preserving affordable housing developments.

The Treasury has clarified that states can reinvest the money from affordable housing long-term loans once the revenue is received. The income from reinvesting in affordable housing does not need to be repaid to the Treasury.

Recipients have the flexibility to design affordable housing projects if they are related or proportional to addressing the negative impact of COVID-19. Additional information is available in the Treasury’s Frequently Asked Questions.

Other Resources

Coronavirus State and Local Fiscal Recovery Funds Website:

https://home.treasury.gov/policy-issues/coronavirus/assistance-for-state-local-and-tribal-governments/state-and-local-fiscal-recovery-funds

Affordable Housing How-To Guide:

https://home.treasury.gov/system/files/136/Affordable-Housing-How-To-Guide.pdf

Compliance & Reporting Guidance:

https://home.treasury.gov/system/files/136/SLFRF-Compliance-and-Reporting-Guidance.pdf

Final Rule Frequently Asked Questions:

https://home.treasury.gov/system/files/136/SLFRF-Final-Rule-FAQ.pdf

Email: [email protected]

Infrastructure Investment and Jobs Act Funding Opportunities for States

By Blair Lozier

On August 15, the Biden administration posted a document highlighting funding opportunities in the Infrastructure Investment and Jobs Act. The Council of State Governments has identified the opportunities available to state, territorial and tribal governments. Deadlines for funding applications range from September 2022 to March 2023.

CSG created a timeline of when applications are due. Funding programs are identified by a color that corresponds with their category.

ProgramFederal Agency or DepartmentDeadlinePotential Funding Amount (in millions)Who Qualifies?Transportation ProgramsSafe Streets and Roads for AllDepartment of Transportation9/15/2022$50*Tribal GovernmentsAll Stations Accessibility ProgramFederal Transit Administration9/30/2022$343State Governments [i]Railroad Crossing Elimination ProgramFederal Rail Administration10/4/2022$573State and Tribal Governments [ii]Reconnecting CommunitiesDepartment of Transportation10/13/2022$100*State and Tribal Governments [iii]Power and Clean Energy ProgramsAdvancing Equity through Workforce PartnershipsDepartment of
Energy9/13/2022*$1.5State and Tribal Governments [iv]Preventing Outages and
Enhancing the Resilience of the Electric Grid – Formula
Department of
Energy9/30/2022$459State, U.S. Territories and Tribal Governments [v]Resilience and Legacy Pollution ProgramsMarine DebrisNational
Oceanic and
Atmospheric
Administration10/5/2022$56State, U.S. Territories and Tribal Governments [vi]Coastal Resilience and Habitat RestorationNational
Oceanic and
Atmospheric
Administration10/5/2022$10State, U.S. Territories and Tribal Governments [vii]Community Wildfire Defense Grants Northeast-Midwest Region Southern Region Western Region Tribal GovernmentsForest Service10/7/2022$10*State[viii], U.S. Territories and Tribal Governments [ix]Brownfields ProgramEnvironmental
Protection
Agency11/1/2022$300State and Tribal GovernmentsAbandoned Mine LandsDepartment of
the Interior3/31/2023$72State and Tribal GovernmentsBroadband ProgramsMiddle Mile Broadband Infrastructure ProgramNational
Telecommunications and Information
Administration9/30/2022$980State and Tribal GovernmentsDrinking Water and Clean Water State Revolving FundsEnvironmental
Protection
AgencyOngoingState funding may varyState and Tribal Governments*Funding amount listed is the maximum award per applicant.
All applications are due at 11:59 pm Eastern Standard Time.

[i] Eligible applicants under this program must be designated recipients that operate or allocate funds to inaccessible pre-Americans with Disabilities Act—or “legacy”—rail fixed guideway public transportation systems, and states, territories, Washington, D.C. and local governmental entities that operate or financially support legacy rail fixed guideway public transportation systems and corresponding legacy stations/facilities.

[ii] Eligible applicants are: 1. A state, Washington D.C. and U.S. territories and possessions. 2. A political subdivision of a state. 3. A federally recognized Indian Tribe. 4. A unit of local government or a group of local governments. 5. A public port authority. 6. A metropolitan planning organization. 7. A group of entities described in any of paragraphs (1) through (6).

[iii] Nonprofit organizations, metropolitan planning organizations, units of local government and transportation facility owners are eligible for a capital construction grant individually or in partnership with other applicants eligible for a planning grant. See Notice of Funding Opportunity and Frequently Asked Questions on the website for additional details on eligibility.

[iv] The Department of Energy will only accept new applicants for this funding opportunity.

[v] States may deem other entities as eligible.

[vi] All entities should be able to demonstrate the status of an underserved community.

[vii] All entities should be able to demonstrate the status of an underserved community.

[viii] States and U.S. territories applying for Community Wildfire Defense Grants must apply in their assigned region (i.e., Northeast-Midwest, Southern, Western). See the grant webpage for states and territories that qualify under each region.

[ix] Tribal governments that are not federally recognized are eligible for funding.

State Approaches to Taxing Recreational Marijuana

By Blair Lozier

Recreational marijuana has been legalized in 19 states since 2012. Washington and Colorado were the first states to collect taxes on recreational marijuana. As of June 2022, 12 states have data available on taxes collected: Alaska, Arizona, California, Colorado, Illinois, Maine, Massachusetts, Michigan, Nevada, Oregon, Vermont and Washington. Seven states – Connecticut, Montana, New Jersey, New Mexico, New York, Rhode Island and Virginia – have legalized the recreational use of marijuana, but tax collection data is not yet publicly available.

As more states legalize recreational marijuana use, new tax collection methods have been developed. Six states legalized recreational marijuana in 2021, and each one uses a different tax structure to collect revenue on those transactions.

Below is a graph demonstrating the number of states by year that recreational use of marijuana was legalized.

Source: Insurance Institute for Highway Safety Marijuana Laws by State in Detail

Tax Collection Methods

There is no federal regulation on how states can collect marijuana taxes. States have commonly used three methods for collecting taxes.

1. Percentage-of-price

The consumer pays a tax on the total price of the purchase. The tax varies by state/local district and is set at a higher percentage than regular sales taxes.

2. Weight-based

The distributor is responsible for paying an initial tax based on the weight of the product within various categories of marijuana. Then, the retail distributor adds a tax to the closing price of the retail sale. Different types of marijuana and different parts of the marijuana plant can be taxed separately. For example, states can establish a tax on the flower of a marijuana plant that is different from the tax established on marijuana leaves.

3. Potency-based

The tax level is based on the amount of THC (Tetrahydrocannabinol) in the product being sold. Tax percentages vary across states.

State Approaches

The percentage of price is the most common method of taxing recreational marijuana sales (12 states).  Maine is the only state that collects the tax through the weight-based method. Illinois is the only state to collect through just the potency-based method. Alaska, California and New Jersey collect taxes through weight-based and percentage-of-price. Connecticut and New York collect taxes through potency-based and percentage-of-price.

Local governments receive most of their revenues from taxes on property and sales. States often give discretion to localities and municipalities to determine their tax rates.  Every state except Illinois, Maine and Michigan allows local or municipal governments to collect an additional tax on marijuana purchases.

Even if states implement a weight-based system, many allow localities to implement a percentage-of-price system enforced where the marijuana is purchased.

States dedicate revenue generated from marijuana sales toward various government programs. For example, Arizona uses a percentage-of-price based tax system and dedicates 33% of revenue to community college funding, 33% to law enforcement and fire departments, 24% for the cost of enforcing the new marijuana law and 10% for the Justice Reinvestment Fund. The Justice Reinvestment Fund was established in 2006 to identify opportunities for change and improvement in the criminal justice system.

Many states use the revenue generated from marijuana sales to fund socio-economic programs to support individuals with drug offenses, economic development and educational and community-based initiatives. Several states dedicate revenue generated from marijuana sales toward various government programs. Most states have multiple uses for the revenue generated from recreational marijuana. On the other hand, Colorado, Massachusetts, Rhode Island, Vermont and Washington dedicate all the funding generated from recreational marijuana retail sales to one specific purpose. Rhode Island and Washington allocate these funds to public health and health care systems. Colorado and Vermont support education programs. Massachusetts dedicates funds to public safety. All five states collect tax under the percentage-of-price tax system.

StateTaxable AmountRevenue Dedication
AlaskaWeight-based  
$50 per ounce for flowers
$15 per ounce for stems and leaves
$25 per ounce for immature flowers and buds
$1 per clone
Percentage-of-price
Localities can levy a percentage of the price
50% for programs to reduce repeat criminal offenses 
25% for drug education and treatment programs
25% for the state’s general fund
ArizonaPercentage-of-price
16% for fall retail purchase
5.6% state general sales tax
Localities can generate a local sales tax.
33% for community colleges funding
33% for law enforcement and fire departments
24% for the cost of enforcing the new marijuana law
10% for the Justice Reinvestment Fund
CaliforniaWeight-based  
$9.65 per ounce for flowers
$2.87 per ounce for leaves
$1.35 per ounce for fresh plants  
15% state tax on retail purchases  
7.25% for state general sales tax  
Local governments can determine their percentage-of-price and general local sales tax.
Costs of marijuana legalization Programs that address negative impact of drug use, economic development, academic studies and youth programs
ColoradoPercentage-of-price
15% for wholesale transactions  
15% for retail transactions  
Local governments can also levy a general local sales tax.
Education programs 
Connecticut*Potency-based
0.625 cents per milligram for plants
2.75 cents per milligram for edibles
0.9 cents per milligram for other products
Percentage-of-price
6.35% state general sales tax  
3% for local governments
Social equity programs
Drug-prevention and recovery programs
IllinoisPotency-based
10% of the retail price when THC content is 35% or less
25% of the retail price when THC content is 36% or higher  
All marijuana-infused products are taxed at 20% of the retail price.
Costs associated with marijuana legalization
Remaining revenue:
State general fund
Substance abuse programs
Local government transfers
Criminal justice reform programs
MaineWeight-based  
$335 per pound for flowers or mature plants
$94 per pound for trim
$1.50 per immature plant or seeding
$0.35 per marijuana seed
10% excise tax on retail sales price
50% for public health and safety programs 
50% for law enforcement training programs related to the legalization of marijuana
MarylandNot Yet DeterminedDevelopment of the Cannabis Public Health Advisory Council and the creation of the Cannabis Public Health Fund
MassachusettsPercentage-of-price
10.75% for retail transactions
6.25% for state general sales tax on purchases
3% for local sales tax on purchases
Various public safety programs
MichiganPercentage-of-price
10% tax for retail transactions
6% state general sales tax  
Education,
Transportation
Transfers to local government
MontanaPercentage-of-price
20% tax for retail transaction  
Localities can levy 3% for retail sales purchases
Environmental conservation
Substance abuse prevention and treatment
Veterans’ services
Health careLocal government
Resentencing efforts for people previously convicted for
NevadaPercentage-of-price
15% for wholesale transactions
10% for retail transactions
6.85% for state general sales tax  
Localities can levy a sales tax on all retail purchases.
Education programs State’s rainy-day fund
New Jersey*Weight-based  
33% for retail price per ounce for the first nine months   After the first nine months:
$10 per ounce if the retail sale is $350 or more
$30 per ounce if the retail sale is between $250 and $349
$40 per ounce if the retail sale is between $200 and $249
$60 per ounce if the retail sale is less than $199
Percentage-of-price
6.625% for state general sales tax on purchases  
Localities can levy up to 2% local sales tax on purchases
70% for Impact Zones (i.e., neighborhoods affected by prior marijuana laws)
30% for administrative costs for legalization and for the state general fund
New Mexico*Percentage-of-price
12% for retail transactions until July 2025
Each year the tax will rise 1% until it reaches 18% in 2030.  
State and local sales taxes may also be implemented.
Administration of marijuana statutes,
Localities where the sales transactions occur and
Deposit to state general fund
New York*Percentage-of-price
9% state level excise tax
4% local level excise tax
Potency-based
0.5 cents per milligram of THC for flower
0.8 cents per milligram of THC for concentrates
3 cents per milligram of THC for edibles
School districts
Drug treatment
Public Education
Reinvestment grants for community-based organizations
Administrative and research costs for marijuana usage studies
OregonPercentage-of-price
17% for retail transactions  
Additionally, localities can levy up to 3% of the retail price 
Education programs,
Drug prevention and treatment programs
Transfers to local governments
Rhode IslandPercentage-of-price
7% state general sales tax
10% new cannabis tax
3% municipality tax, wherever marijuana is sold
Public health and public safety
Vermont*Percentage-of-price
14% for retail transactions  
6% for state general sales tax  
Local governments can levy a sales tax.
After-school learning programs
Virginia*Percentage-of-price
21% for retail transactions
3% for local excise tax
5.3% state general sales tax  
Local governments can levy a sales tax
Pre-kindergarten programs
Reinvestment grants for underserved communities
Drug prevention and treatment programs
WashingtonPercentage-of-price
37% for retail transactions
6.5% for general state sales tax  
Local governments can levy a local sales tax
Health care programs
*States that have enacted marijuana legislation, but no revenue data has been made publicly available.

For more information on marijuana taxes, please visit The Book of States, produced annually by The Council of State Governments: https://issuu.com/csg.publications/docs/bos_2021_issuu

Important Implications of the Congressional Budget Office’s Long-Term Budget Outlook on State Fiscal Policy 

By: Valerie Newberg 

The Congressional Budget Office released its annual Long-Term Budget Outlook in July. The Long-Term Budget Outlook is a 30-year projection of different economic factors like government spending and revenues. The outlook is used as a tool for policymakers to evaluate the impact of proposed legislation against baseline economic data, such as the gross domestic product (GDP), which measures the total output of the United States economy and provides insight into to economic growth. This year’s report represents a continuation of recent forecasts, predicting a rise in mandatory federal spending on entitlement programs such as Medicare and Medicaid, increased interest costs on the deficit and a historically high debt to GDP ratio. Regardless of how the federal government approaches the unprecedented conditions predicted, states will have to grapple with changes in funding and fiscal practices to ensure their budgets remain balanced. 

Here are three takeaways for state leaders from this year’s report: 

The economy remains volatile, showing signs of slowing. 

There are four main projections calculated in the outlook: the deficit, debt, spending and revenues. While states are trying to predict the forecast and how to prepare, all four factors point to stormy weather and rainy days with potential long-term economic difficulties: 

Under current fiscal practices, the budget deficit is expected to climb from 2.3% of the GDP to 3.9% at the end of 2052. As the deficit continues to grow, the national debt will climb from its projected 2022 total of 98% of the GDP to 185% in 2052, nearly doubling in size and reaching a historic high in 2031.  Even as the end of federal pandemic relief programs results in a dip in federal spending, the budget will ultimately rise from 23.5% to 30.2% of the GDP by 2052. Increases in spending are driven by mandatory expenditures for programs like Medicare and Social Security, which will gain more dependents and experience higher costs as the U.S. population ages. Additionally, interest on the deficit will contribute to historically high spending. Finally, revenues are projected to spike in 2025 as a result of the expiration of the Tax Cuts and Jobs Act of 2017. The CBO’s analysis makes clear the opportunities and feasibility of reducing the deficit through expenditure and tax-based policies and lays out the growing consequences of inaction. But until changes are made, federal spending will continue to outpace revenues. 

While these projections are focused on national trends and policies, states will not be immune to the effects of economic changes; state policymakers can expect economic uncertainty to impact both federal grants to states and the circumstances around state revenue collection. 

Tax changes in 2025 are expected to temporarily increase federal revenues and will continue to impact state budgets and tax codes.  

Scheduled changes to the tax code will have an impact on the national economy and state policies, but this impact will vary across states and income groups. The 2017 Tax Cuts and Jobs Act had disparate effects on state budgets and tax codes, with many states electing to align their tax laws with most or all of the federal tax legislation. Key provisions of the Tax Cuts and Jobs Act that lower taxes for individuals and families are set to automatically expire in 2025, including the expanded Child Tax Credit and the State and Local Tax Deduction. The State and Local Tax Deduction impacts high-income taxpayers in states such as California, New Jersey and New York most aggressively because the $10,000 cap on deductions generally prevents those who pay the most in state and local taxes from deducting their entire liability from their federal taxes. Lawmakers in such states have sought solutions to ease this burden and prevent the loss of high-income residents.  

The future of these provisions is unclear, but the Congressional Budget Office’s analysis of the tax plan shows a nearly $1.5 trillion increase in the deficit over the next 10 years. As such, federal policymakers may look to more wide-sweeping changes to tax codes that would further impact state policies. 

Congress may look to cut discretionary spending for state grants and other projects to decrease outlays.  

The Congressional Budget Office predicts that continued levels of discretionary spending between an average of 6.2% and 7% of the GDP will contribute substantially to federal debt levels. This debt, held by the public, leaves the economy at an increased risk of experiencing a fiscal crisis that would disrupt global financial stability. With adjustments in the largest mandatory spending programs such as Medicare and Social Security requiring a 60-person majority to pass the Senate and 74 percent of Americans saying benefits should not be reduced, it is more likely that funding for discretionary spending programs and grants to states would be reduced to contain expenditure levels.  

Since the federal government provides an average of one-third of state revenues, states are especially vulnerable to disruptions due to changes in federal discretionary spending for programs like Special Supplemental Nutrition Program for Women, Infants, and Children (WIC), Head Start, the Low Income Home Energy Assistance Program (LIHEAP), law enforcement training and development assistance, and the Community Block Development Grant. States rely on these programs to provide for their most vulnerable citizens and policymakers will need to remain informed of their options for sustaining them when faced with reductions in federal funding.  

With President Biden signing into law the Inflation Reduction Act, which will reduce the deficit by over $300 million, fiscal consolidation through reduced spending and increased taxes is clearly a top priority for lawmakers in Washington. States should expect to see further action taken, and by remaining educated on the impacts of the federal budget and the CBO’s Long-Term Budget Outlook on their states’ circumstances, leaders can prepare to effectively tackle the economic issues that impact the everyday lives of their constituents. 

How States are Putting American Rescue Plan Dollars to Work

By Rachel Dietert and Ben Reynolds

The American Rescue Plan Act of 2021 includes $350 billion in new funding for state, local, territorial and tribal governments through the Coronavirus State and Local Fiscal Recovery Fund. Within that fund, $195 billion is distributed to state governments and Washington, D.C. While there are some restrictions on the use of funds, states have considerable discretion. CSG has collected allocation data from state actions, enacted legislation and mandatory State Recovery Plan Performance Reports. The Council of State Governments ARPA Utilization Database includes information on these allocations through December of 2021. Data is organized into 27 “policy areas” based on funding categories. Further subcategories are provided to include more detail on the funding.

CSG is producing a series of articles focused on how states are using the State Fiscal Recovery Fund. The first article can be found here.

This second article examines the state policy areas receiving the greatest investment.

Revenue and Taxation ($21.1 billion) and Management and Administration ($19.7 billion) are the top two policy areas across the country, receiving substantially more funding than others. Revenue and Taxation was the top policy area as states elected to use funds to replace revenue lost because of the pandemic. Revenue replacement has helped states address a decrease in state tax revenue, which from April through June 2020 fell 25% compared to the same quarter of 2019 (Pew). Management and Administration investments are another way states are addressing the impacts of the pandemic. Examples of administration costs include efforts to ensure program sustainability by increasing staff or contracting with consultants.

Eleven states allocated the most funding toward Unemployment. Many states made substantial deposits into unemployment insurance funds. Arizona, for example, allocated $758.8 million into its Unemployment Insurance Trust Fund.

Revenue and Taxation was the second most funded policy area. Most states used their funding toward revenue replacement. California transferred $9.2 billion to address its revenue loss due to the pandemic.

The top policy area in four states was Broadband, and another four states top policy area was Infrastructure. New Hampshire allocated $659,734 to fund its Broadband Connectivity Program while North Dakota is using $150 million to fund natural gas pipeline infrastructure grants to develop a high-pressure transmission pipeline to transport natural gas to eastern North Dakota.

Alaska, Alabama, and Oregon invested heavily in Justice and Public Safety, more than any other area. Alaska budgeted $24.7 million to fund its Wildlife State Troopers and $28.8 million for its Office of Public Advocacy. Alabama appropriated $400 million to its Department of Corrections for its Capital Improvement Fund. Oregon used $37.3 million to address deferred maintenance and administrative services for its Department of Corrections.  

Utah has allocated the most funds for Education. The stateused $15 million to offer one-year tuition and fee scholarships to individuals who deferred or interrupted enrollment because of the pandemic.

Idaho was the only state in which the highest amount of funds was for COVID-19 response, appropriating $50 million.

The top area for spending in CSG South ($3.2 billion) and CSG West ($11.1 billion) states was Revenue and Taxation. The top policy priority for CSG East states was Management and Administration. For CSG Midwest states, it was Unemployment. All four regions had Unemployment within their top five policy areas. Revenue and Taxation was in the top five in the East, West and South.

States lost a considerable amount of revenue during the pandemic and are using federal funds to make up for it. State governments are also acknowledging how unemployment rates were impacted by the pandemic. Millions of people lost their jobs in the early months of the pandemic. But the unemployment rate had fallen to 4.9% by October 2021.

(Top Policy Area by Number of Programs Funded Graphic Goes Here)

Revenue and Taxation and Management and Administration were the most invested categories and most of those funds have been used for fiscal health recovery. States also used the Coronavirus State and Local Recovery Funds to target certain areas and programs that needed additional resources, but may not have received them in “normal” years.

Among subcategories, State Fiscal Recovery Funds were invested most heavily in Health and Human Services programs (239), followed by Economic and Community Development (155) and Justice and Public Safety (134).

Of the 239 Health and Human Services programs funded, 56 involve public health. States vary in their public health needs and the programs reflect that. For example, Arkansas budgeted $10.5 million to increase hospital bed capacity while Maine allocated $102,986 to establish a program to offer free well water treatment for low-income residents. Other program areas funded in Health and Human Services include:

Mental Health (26)Behavioral Health (22)Nutritional Stability (19)Long-term Care Facilities (10)

Another top program priority for states was Economic and Community Development. Economic development initiatives received the most state funds. Indiana allocated $500 million for its Regional Economic Acceleration and Development Initiative, while New Jersey is spending $15 million to develop its World Cup and Meadowlands Complex. Ensuring small businesses survived the pandemic was another high priority for states. North Carolina used $500 million to establish the Businesses Recovery Grant program to aid businesses that suffered damage due to the pandemic. Wisconsin used $46.7 million for grants to assist with costs businesses incurred for health and safety improvements. Other programs funded under Economic and Community Development include:

Tourism (30)Community Development (13)Parks and Recreation (4)Diversity, Equity, and Inclusion (2)

The third most funded policy area by programs was Justice and Public Safety. The top program under this policy area was Emergency Management. Florida used $1 million to fund its Emergency Preparedness and Response Fund, while Utah used $6.9 million to update its Department of Corrections communication equipment and enhance its interoperability. Other programs funded under Justice and Public Safety include:

Violence Prevention (10)Corrections (10)Crime Victim Services (8)Law Enforcement (8)

Through 2021, states allocated their ARPA funds for immediate needs. States faced revenue shortfalls and invested funding for Covid testing and other health care and health system improvements. Since states have until 2024 to allocate their APRA funds and many immediate needs for funds have been accomplished, states are going to be more flexible and creative with their ARPA funding. States will use this remaining funding to address a variety of needs.

How States are Putting American Rescue Plan Dollars to Work

By Rachel Dietert and Ben Reynolds

The American Rescue Plan Act of 2021 includes $350 billion in new funding for state, local, territorial and tribal governments through the Coronavirus State and Local Fiscal Recovery Fund. Within that fund, $195 billion is distributed to state governments and Washington, D.C. While there are some restrictions on the use of funds, states have considerable discretion. CSG has collected allocation data from state actions, enacted legislation and mandatory State Recovery Plan Performance Reports. The Council of State Governments ARPA Utilization Database includes information on these allocations through December of 2021. Data is organized into 27 “policy areas” based on funding categories. Further subcategories are provided to include more detail on the funding.

CSG is producing a series of articles focused on how states are using the State Fiscal Recovery Fund. The first article can be found here.

Revenue and Taxation ($21.1 billion) and Management and Administration ($19.7 billion) are the top two policy areas across the country, receiving substantially more funding than others. Revenue and Taxation was the top policy area as states elected to use funds to replace revenue lost because of the pandemic. Revenue replacement has helped states address a decrease in state tax revenue, which from April through June 2020 fell 25% compared to the same quarter of 2019 (Pew). Management and Administration investments are another way states are addressing the impacts of the pandemic. Examples of administration costs include efforts to ensure program sustainability by increasing staff or contracting with consultants.

Eleven states allocated the most funding toward Unemployment. Many states made substantial deposits into unemployment insurance funds. Arizona, for example, allocated $758.8 million into its Unemployment Insurance Trust Fund.

Revenue and Taxation was the second most funded policy area. Most states used their funding toward revenue replacement. California transferred $9.2 billion to address its revenue loss due to the pandemic.

The top policy area in four states was Broadband, and another four states top policy area was Infrastructure. New Hampshire allocated $659,734 to fund its Broadband Connectivity Program while North Dakota is using $150 million to fund natural gas pipeline infrastructure grants to develop a high-pressure transmission pipeline to transport natural gas to eastern North Dakota.

Alaska, Alabama, and Oregon invested heavily in Justice and Public Safety, more than any other area. Alaska budgeted $24.7 million to fund its Wildlife State Troopers and $28.8 million for its Office of Public Advocacy. Alabama appropriated $400 million to its Department of Corrections for its Capital Improvement Fund. Oregon used $37.3 million to address deferred maintenance and administrative services for its Department of Corrections.  

Utah has allocated the most funds for Education. The stateused $15 million to offer one-year tuition and fee scholarships to individuals who deferred or interrupted enrollment because of the pandemic.

Idaho was the only state in which the highest amount of funds was for COVID-19 response, appropriating $50 million.

The top area for spending in CSG South ($3.2 billion) and CSG West ($11.1 billion) states was Revenue and Taxation. The top policy priority for CSG East states was Management and Administration. For CSG Midwest states, it was Unemployment. All four regions had Unemployment within their top five policy areas. Revenue and Taxation was in the top five in the East, West and South.

States lost a considerable amount of revenue during the pandemic and are using federal funds to make up for it. State governments are also acknowledging how unemployment rates were impacted by the pandemic. Millions of people lost their jobs in the early months of the pandemic. But the unemployment rate had fallen to 4.9% by October 2021.

Revenue and Taxation and Management and Administration were the most invested categories and most of those funds have been used for fiscal health recovery. States also used the Coronavirus State and Local Recovery Funds to target certain areas and programs that needed additional resources, but may not have received them in “normal” years.

Among subcategories, State Fiscal Recovery Funds were invested most heavily in Health and Human Services programs (239), followed by Economic and Community Development (155) and Justice and Public Safety (134).

Of the 239 Health and Human Services programs funded, 56 involve public health. States vary in their public health needs and the programs reflect that. For example, Arkansas budgeted $10.5 million to increase hospital bed capacity while Maine allocated $102,986 to establish a program to offer free well water treatment for low-income residents. Other program areas funded in Health and Human Services include:

  • Mental Health (26)
  • Behavioral Health (22)
  • Nutritional Stability (19)
  • Long-term Care Facilities (10)

Another top program priority for states was Economic and Community Development. Economic development initiatives received the most state funds. Indiana allocated $500 million for its Regional Economic Acceleration and Development Initiative, while New Jersey is spending $15 million to develop its World Cup and Meadowlands Complex. Ensuring small businesses survived the pandemic was another high priority for states. North Carolina used $500 million to establish the Businesses Recovery Grant program to aid businesses that suffered damage due to the pandemic. Wisconsin used $46.7 million for grants to assist with costs businesses incurred for health and safety improvements. Other programs funded under Economic and Community Development include:

  • Tourism (30)
  • Community Development (13)
  • Parks and Recreation (4)
  • Diversity, Equity, and Inclusion (2)

The third most funded policy area by programs was Justice and Public Safety. The top program under this policy area was Emergency Management. Florida used $1 million to fund its Emergency Preparedness and Response Fund, while Utah used $6.9 million to update its Department of Corrections communication equipment and enhance its interoperability. Other programs funded under Justice and Public Safety include:

  • Violence Prevention (10)
  • Corrections (10)
  • Crime Victim Services (8)
  • Law Enforcement (8)

Through 2021, states allocated their ARPA funds for immediate needs. States faced revenue shortfalls and invested funding for Covid testing and other health care and health system improvements. Since states have until 2024 to allocate their APRA funds and many immediate needs for funds have been accomplished, states are going to be more flexible and creative with their ARPA funding. States will use this remaining funding to address a variety of needs.

A Guide to Resources from the CSG Overseas Voting Initiative

The goal of the Overseas Voting Initiative is to improve the voting process for citizens identified in the Uniformed and Overseas Citizens Absentee Voting Act. The Council of State Governments assists the Federal Voting Assistance Program in aligning its ongoing efforts to engage stakeholders. The program’s working group researches critical areas for improving overseas voting processes.

The Overseas Voting Initiative at CSG has developed a series of articles, reports and resources that may aid state leaders as they respond to questions and confusion related to overseas voting.

In 2019, CSG released a comprehensive report examining the sustainability of balloting solutions for military and overseas voting. The report discusses barriers to sustainable balloting technology and examines why current solutions for ensuring the successful return of ballots have not been as sustainable as intended. It also identifies obstacles that must be addressed in future research.

Overseas voters face several challenges when attempting to cast their votes. This article discusses how military and overseas voting ballots are counted. The U.S. Election Assistance Commission conducts the Elections Administration Voting Survey every two years to identify factors that influence successful vote submission. However, the survey does not sufficiently isolate factors in overseas voter experiences. In response, the working group issued a set of recommendations for streamlining and improving the survey. The working group recommended the development and implementation of a survey data standard that would identify and store transaction-level data on voter experiences — without identifying information.

  • This report provides more information about the recommendations for data standardization.
  • This article identifies the benefits of the data standard.
  • This article highlights the progress that specific states, particularly Colorado, have made in implementing this standard.

Ballot duplication is another area of concern. Ballot duplication is the process of replacing damaged or improperly marked ballots (i.e., the voting system cannot read the ballot) with a readable ballot that preserves voter intent, according to the U.S. Election Assistance Commission.

  • This article explains ballot duplication, how it is conducted and why it is important.
  • CSG has developed recommendations for duplication of damaged and/or machine unreadable ballots and frequently asked questions (and answers) on ballot duplication.
  • The Overseas Voting Initiative has developed recommendations on Common Access Cards, digital signature verification and responding to unreadable or damaged ballots.

CSG research has also addressed misinformation and disinformation. Access to accurate, unbiased information is crucial to preserving the integrity and security of any election. This CSG article on election safeguards provides an overview of measures that the U.S. has implemented to combat disinformation.

Finally, CSG has developed a position paper with recommendations on how to achieve a balance between security and ballot access in electronic ballot return.