Executive Working Group Meets to Discuss Community Intervention and Correctional Responses to Domestic Violence in Rhode Island
State Legislation Provides Hope for Rising Insulin Costs

By Lexington Souers
Nearly 31% of the 37 million Americans with diabetes use insulin to manage the condition. Annually, patients spend an average of $434 on insulin. That amount nearly doubles for patients who are uninsured for an entire year. Between 2014 and 2017, uninsured people represented 80% of the diabetic population that paid full price for an insulin prescription, according to a study by the Commonwealth Fund. Estimates suggest around 27% of a patient’s total out-of-pocket health care spending went toward purchasing insulin. This high out-of-pocket cost can lead to insulin rationing, a dangerous decision that may result in higher medical costs. Rationing insulin can lead to emergency room visits, amputations and death. Uninsured American’s are more likely to ration their insulin. A 2021 survey found that of the 17% of insulin dependent patients that rationed their insulin, 29% were uninsured.
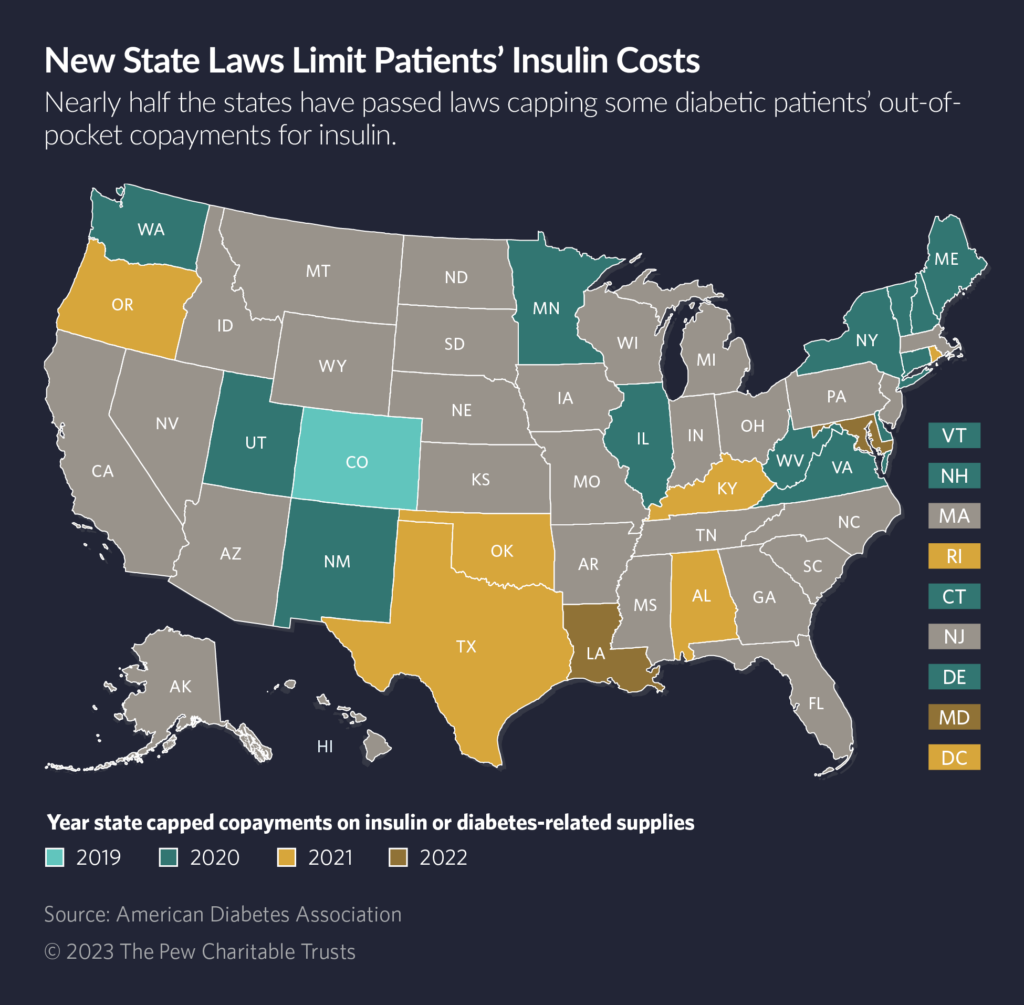
Beginning with Colorado in 2019, 22 states and the District of Columbia enacted price caps for insulin distributed to those who were insured. Legislation for insulin caps received broad bipartisan support from lawmakers, who recognize the dangers of insulin rationing because of cost. These caps range from $25 to $100 a month depending on the state. Many caps do not cover diabetes related equipment, with fewer than five states capping the cost of supplies or devices such as pumps, blood glucose monitors and syringes.
In 2023, 11 states proposed legislation to cap insulin prices and others have brought legislation to ease the costs of diabetes related equipment. Montana, Arizona and California proposed a $35 per 30-day supply cap, while Missouri lawmakers proposed a cap at $30 for a 30-day supply. Many states also allow patients to pay a lower copay, so long as the copay is less than the capped price. Nebraska has two bills up for debate during this year’s session. One bill would cap insulin at $35 for 30 days, while the other would cap the price at $100 for a 30-day supply. Both bills have received support from community stakeholders. Massachusetts lawmakers have filed legislation that would cap both insulin and the supplies needed. The proposed legislation would cap a 30-day supply of insulin at $25, oral medication at $50 per 30-days and equipment at $100.
States have recognized diabetes costs often extends past prescription drugs, given that other tools are often needed for the body to effectively utilize insulin. In 2022, Rhode Island capped diabetes equipment and supplies costs at $25 per 30-day supply for insured citizens. Connecticut, Delaware and the District of Columbia have similar caps on supplies. This year, Kansas and Kentucky lawmakers also filed legislation to cap the cost of diabetes equipment. Kentucky’s HB 376 did not receive a committee hearing, but the Kansas bill was sent to the Committee on Health and Human Services. Florida lawmakers introduced HB 967 which would provide coverage for continuous glucose monitors for Medicaid recipients meeting certain requirements.
While states with insulin caps are aiding insured Americans, there are limits on who legislation can help. Compliance with the Employee Retirement Income Security Act of 1974, known as ERISA, means states are unable to regulate self-insured plans, which comprise 64% of the total employer-based insurance market. State can create programs for the uninsured or underinsured. Only Colorado and Minnesota place caps on how much an uninsured or underinsured person pays for insulin. Pharmaceutical drug companies capped certain insulin types at $35 per 30-day supply or established assistance programs offering free insulin. Programs created by drug manufacturers often have complex requirements and lack transparency, disqualifying many who need access to insulin.
Insulin prices are due, in part, to the production process. Insulin is a biologic product, which is typically more expensive to make than chemically derived drugs. The three pharmaceutical companies that dominate the insulin market supply all of the insulin in the U.S., along with a majority of the global market. This allows those companies to set the market price, despite low production costs for insulin. Studies have found that an increase in biosimilar products would save payers, patients and other stakeholders an estimated $4.1 billion in savings over a five-year period.
State Legislation Provides Hope for Rising Insulin Costs
By Lexington Souers
Nearly 31% of the 37 million Americans with diabetes use insulin to manage the condition. Annually, patients spend an average of $434 on insulin. That amount nearly doubles for patients who are uninsured for an entire year. Between 2014 and 2017, uninsured people represented 80% of the diabetic population that paid full price for an insulin prescription, according to a study by the Commonwealth Fund. Estimates suggest around 27% of a patient’s total out-of-pocket health care spending went toward purchasing insulin. This high out-of-pocket cost can lead to insulin rationing, a dangerous decision that may result in higher medical costs. Rationing insulin can lead to emergency room visits, amputations and death. Uninsured American’s are more likely to ration their insulin. A 2021 survey found that of the 17% of insulin dependent patients that rationed their insulin, 29% were uninsured.
Beginning with Colorado in 2019, 22 states and the District of Columbia enacted price caps for insulin distributed to those who were insured. Legislation for insulin caps received broad bipartisan support from lawmakers, who recognize the dangers of insulin rationing because of cost. These caps range from $25 to $100 a month depending on the state. Many caps do not cover diabetes related equipment, with fewer than five states capping the cost of supplies or devices such as pumps, blood glucose monitors and syringes.
In 2023, 11 states proposed legislation to cap insulin prices and others have brought legislation to ease the costs of diabetes related equipment. Montana, Arizona and California proposed a $35 per 30-day supply cap, while Missouri lawmakers proposed a cap at $30 for a 30-day supply. The measure in Montana was enacted and signed by the governor. In California, the bill passed in both chambers, but California Gov. Gavin Newsom vetoed the legislation. Many states also allow patients to pay a lower copay, so long as the copay is less than the capped price. Nebraska has two bills up for debate during this year’s session. One bill would cap insulin at $35 for 30 days, while the other would cap the price at $100 for a 30-day supply. Both bills received support from community stakeholders. One of the bills, LB 799, was added to another bill which successfully became law. Massachusetts lawmakers filed legislation in 2022 that would cap both insulin and the supplies needed. The proposed legislation would cap a 30-day supply of insulin at $25, oral medication at $50 per 30-days and equipment at $100.
States have recognized diabetes costs often extends past prescription drugs, given that other tools are often needed for the body to effectively utilize insulin. In 2022, Rhode Island capped diabetes equipment and supplies costs at $25 per 30-day supply for insured citizens. Connecticut, Delaware and the District of Columbia have similar caps on supplies. This year, Kansas and Kentucky lawmakers also filed legislation to cap the cost of diabetes equipment. Kentucky’s HB 376 did not receive a committee hearing, and the Kansas bill remained in the Committee on Health and Human Services. Florida lawmakers successfully passed HB 967 which will provide coverage for continuous glucose monitors for Medicaid recipients meeting certain requirements.
While states with insulin caps are aiding insured Americans, there are limits on who legislation can help. Compliance with the Employee Retirement Income Security Act of 1974, known as ERISA, means states are unable to regulate self-insured plans, which comprise 64% of the total employer-based insurance market. State can create programs for the uninsured or underinsured. Colorado and Minnesota place caps on how much an uninsured or underinsured person pays for insulin. Pharmaceutical drug companies capped certain insulin types at $35 per 30-day supply or established assistance programs offering free insulin. Programs created by drug manufacturers often have complex requirements and lack transparency, disqualifying many who need access to insulin.
Insulin prices are due, in part, to the production process. Insulin is a biologic product, which is typically more expensive to make than chemically derived drugs. The three pharmaceutical companies that dominate the insulin market supply all of the insulin in the U.S., along with a majority of the global market. This allows those companies to set the market price, despite low production costs for insulin. Studies have found that an increase in biosimilar products would save payers, patients and other stakeholders an estimated $4.1 billion in savings over a five-year period.
Sandboxes and “Go Bags”: How New Jersey Election Officials Prepare for Crises

The Council of State Governments (CSG) Overseas Voting Initiative (OVI) 2019 report Examining the Sustainability of Balloting Solutions for Military and Overseas Voting, said “states are under increasing legislative pressure to have contingency plans in place for all aspects of their election systems, including the Uniformed and Overseas Citizens Absentee Voting Act (UOCAVA) balloting solutions, due to recent national disasters such as Hurricane Sandy, Hurricane Maria and Hurricane Dorian, and global threats of terrorism, civil disobedience, cyberattacks and mail service disruptions.” A case study in emergency preparedness can be found in New Jersey.
Superstorm Sandy is known as such because it was more than just a hurricane that ripped through the East Coast of North America beginning on October 22, 2012. Sandy was a Category 3 hurricane followed immediately by a post-tropical cyclone that made landfall in rapid-fire succession over several days. The storm did not end until November 2 after killing at least 117 people in the United States plus 69 people in Canada and the Caribbean. It also left $68 billion in destruction in its wake, even forcing the closure of the New York Stock Exchange for two consecutive days, the first time this happened since 1888 due to a weather catastrophe.
The state of New Jersey sustained a great deal of damage as a result of Sandy. Election Day in 2012 – a presidential election year – was on November 6, just four days after Superstorm Sandy ended. State and local election officials in affected areas – especially in hardest hit New Jersey – worked in response to ensure citizens displaced or disrupted by the storm were able to exercise their right to vote. Sandy was obviously no easy situation to manage, but a scenario not unfamiliar to election officials across the nation.
Election officials are some of our nation’s greatest go-to resources for contingency planning and logistical challenges. They are leaders in thought and action when it comes to disaster preparedness and resilience of operations. Elections must always happen as scheduled, in spite of any hurdle, disruption, or disaster. New Jersey election officials in a post-Sandy environment certainly typify this statement.
If a state is going to supply its counties with necessary tools for today’s ever-evolving technology and security environments, they wanted to make their investment – paid for through the Help America Vote Act Election Security Funds – stretch as far as possible to include tools for disaster recovery, contingency planning, redundancy, and sandboxing for UOCAVA and other electronically returned ballots.
Thus, in addition to the Chromebook with its sandboxing environment, New Jersey’s Go Bags were later augmented to include a second Chromebook to serve as a redundant back-up, as well as a printer, a hot spot router, multiple power supplies, paper, and pens. These items were then fitted in secure, durable hard-shell cases for each local election office.
New Jersey’s aptly-termed “Go Bag” is an example of a statewide initiative to enhance contingency planning. Local election jurisdictions can be prepared for all types of unforeseen circumstances and emergencies that can negatively impact the administration of elections in their state.
New Jersey’s Go Bag is a portable election office, developed by the New Jersey Division of Elections team as a contingency plan and business process continuity tool. It contains the necessary supplies for local election officials in New Jersey’s 21 counties to conduct business from anywhere and meet multiple disaster scenarios.
In addition to its role in business continuity efforts, the Go Bag also serves as a stand-alone workstation. It enables the detection and mitigation of malware and other cybersecurity threats from email attachments and other electronic files received by local election officials.
Each Go Bag contains a dedicated, stand-alone, mobile Chromebook workstation with a “sandboxing environment,” for retrieval of electronic ballots, as New Jersey law permits military and overseas citizen ballots to be returned electronically. New Jersey typically requires a mailed ballot as well, but that requirement may be waived in a declared emergency. A sandbox is a separate, partitioned environment where electronic ballot attachments can be opened securely by election officials to isolate potential viruses or other malware prior to an email entering the local network or mail server. If threatening activity is detected, the email is flagged and the election officials is prevented from unknowingly opening the malicious content, thereby infecting their network. Thus, sandboxing provides New Jersey’s local election offices with a more protective environment where electronic ballot attachments and other balloting materials can be opened securely – and separately from their other systems potentially averting a major issue. For reference, New Jersey’s sandboxing environment deployment is similar to the technology implementation in South Carolina as described in this OVI article.
It’s important to note that New Jersey’s local election duties are divided among multiple county offices. County clerks use the sandboxing solution to process military, overseas citizen, and vote-by-mail applications, while the county boards of election use them to safely open returned electronic ballots from voters authorized to cast electronic ballots. Therefore, the state purchased 51 sandboxing environments – and 51 Go Bags – for all the local election official offices across their 21 counties including county clerks, board of elections offices, and in the case of New Jersey’s larger counties, the county superintendents of elections /commissioners of registration.
New Jersey’s dual purpose “Go Bag” for each of its 21 counties equipped with two Chromebooks, a printer, a hot spot router, multiple power supplies, paper, and pens in a case.
New Jersey’s Go Bags are an effective tool for mitigating cybersecurity risks and enabling continuity of election operations in the face of unforeseen logistical challenges in any type of emergency. Thus, we’re sharing this implementation overview from New Jersey in the event it helps other states and local jurisdictions who are considering various election risk mitigation strategies. We also encourage state and local election officials to share their ideas or proven methods with us by emailing us at [email protected].
The post <strong>Sandboxes and “Go Bags”: How New Jersey Election Officials Prepare for Crises</strong> appeared first on CSG OVI.
Recommendations for Implementing Opioid Use Disorder Treatment Measures

By Ishara Nanayakkara
In October, The Pew Charitable Trusts released an analysis of the core measures states can identify to address and mitigate the opioid epidemic. The information included in this article originates from this analysis.
This article is the second in a three-part series. The first article can be viewed here.
In 2021, the U.S. set a record high for fatal opioid overdoses. However, when data is used to address opioid use disorder, effective change can be made. The Pew Charitable Trusts developed a series of recommendations for state policymakers to consider when implementing opioid use disorder treatment measures. The recommendations, which are addressed in Pew’s analysis, were developed by an expert panel along with a review of important literature. A summary of these recommendations can be found below.
1. Publicly Report Opioid Use Disorder and Treatment Data
In addition to publicly reporting overdose death statistics, states should also report several core measures, including availability of opioid use disorder measures and use by regions and demographic groups. Research found that public reporting results in improvements in outcomes.
2. Create a Plan to Use Opioid Use Disorder Treatment Data
Lawmakers responsible for addressing the crisis should regularly review available data and use it to inform policy decisions. A point person should be assigned to ensure data is updated and relevant, convene stakeholders across agencies, groups and communities and review resources available to support improvement efforts.
3. Disaggregate Data to Improve Health and Equity
There are significant differences in overdose death rates based on race and ethnicity. A study conducted by the CDC found that the overdose death rate increased most among Black individuals at 44% and American Indian/Alaskan Native people at 39%, while the increase for Caucasians was 22%. Additionally, due to barriers to treatment, Black and Hispanic people are less likely to seek and continue treatment. Disaggregating data by factors such as race, ethnicity, location, gender and age provides policymakers with information on where to best direct resources, which will help ensure that all people have access to services.
4. Integrate Community Members and Providers into Decision-making
People with lived experiences, including those with opioid use disorder and providers, provide valuable insight into effective areas of the treatment system and those requiring improvement. For instance, researchers in Minnesota found that members of tribal nations with opioid use disorder had a distrust and fear of the healthcare system and that treatment plans did not acknowledge or incorporate traditional healing systems. This information provides insight into how the treatment system can be altered to better meet the needs of tribal nations. Knowing similar information about other demographics may help policymakers target areas of concern.
In addition to providing policymakers with valuable information on how to best serve their constituents, community members also benefit from this information sharing process as they have their voices heard, gain new skills, and may be compensated.
Treatment providers should also be involved when analyzing metrics. Individuals moving through the cascade of care system will interact with multiple providers in varying settings, including emergency departments, peer recovery coaches, and opioid treatment providers. Professionals can work together to support patient’s smooth transitions from one part of the process to the next.
5. Address Data Challenges
The quality of data regarding race and ethnicity provided by insurers varies as many commercial health insurance plans do not collect data on these factors. State Medicaid agencies are required to collect demographic information and acquire self-reported data provided by patients during the application process. This means that data accuracy and completeness may vary across states. Researchers have raised “high concerns” about race or ethnicity information quality in 19 states due to missing data and mismatches between responses on Medicaid applications and Census Bureau surveys. To improve accuracy in reporting, experts recommend employing intake workers to help applicants fill out forms or utilizing standard reporting forms that provide more specificity instead of using broad ethnicity categories, such as Asian or Hispanic. States can also compare data and strategies on core performance measures to identify inequalities among communities and potential solutions.
To read about case studies, see The Pew Charitable Trusts issue brief, “States Should Measure Opioid Use Disorder Treatment to Improve Outcomes.” These examples depict success in areas where states collected and acted on data. By using the core opioid use disorder treatment measures, treatment systems can be reshaped to effectively address the crisis.
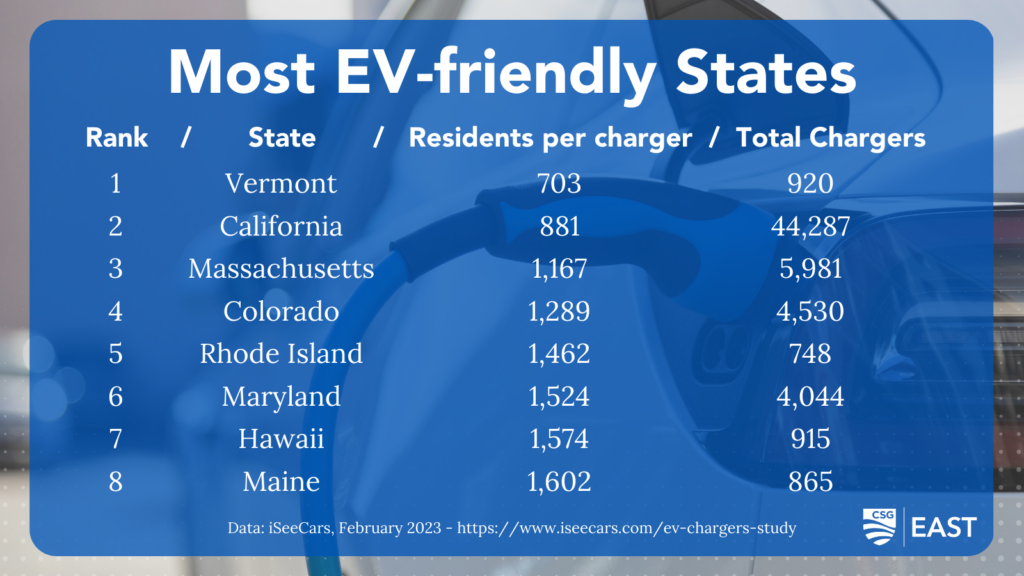
Eastern states finding early success in developing Electric Vehicle infrastructure

In just the past two years, the market share of electric vehicles (EVs) has more than doubled, rising from 2.7 percent to 6.4 percent by the end of 2022.
New EVs are rolling onto the market at a blistering pace. As motor vehicle manufacturers race to compete for market share, companies like Ford, Chevy, and Hyundai are investing significantly in their all-electric vehicle lines, while Tesla’s Model Y and Model 3 continue to vastly outsell the competition.
The message is clear: the future is electric.
But, as with most innovations, that future may not reach everyone’s zip code (or driveway) at the same time.
The post Eastern states finding early success in developing Electric Vehicle infrastructure appeared first on CSG ERC.
Private: Breaking Down Barriers: Lessons from Housing and Justice System Collaborations
The post Private: Breaking Down Barriers: Lessons from Housing and Justice System Collaborations appeared first on CSG Justice Center.
Eastern states finding early success in developing Electric Vehicle infrastructure
In just the past two years, the market share of electric vehicles (EVs) has more than doubled, rising from 2.7 percent to 6.4 percent by the end of 2022.
New EVs are rolling onto the market at a blistering pace. As motor vehicle manufacturers race to compete for market share, companies like Ford, Chevy, and Hyundai are investing significantly in their all-electric vehicle lines, while Tesla’s Model Y and Model 3 continue to vastly outsell the competition.
The message is clear: the future is electric.
But, as with most innovations, that future may not reach everyone’s zip code (or driveway) at the same time.
Breaking Down Barriers: Lessons from Housing and Justice System Collaborations
The post Breaking Down Barriers: Lessons from Housing and Justice System Collaborations appeared first on CSG Justice Center.